For laboratory research only. Not for human or animal use. This article gives no dosing, administration or therapeutic advice.
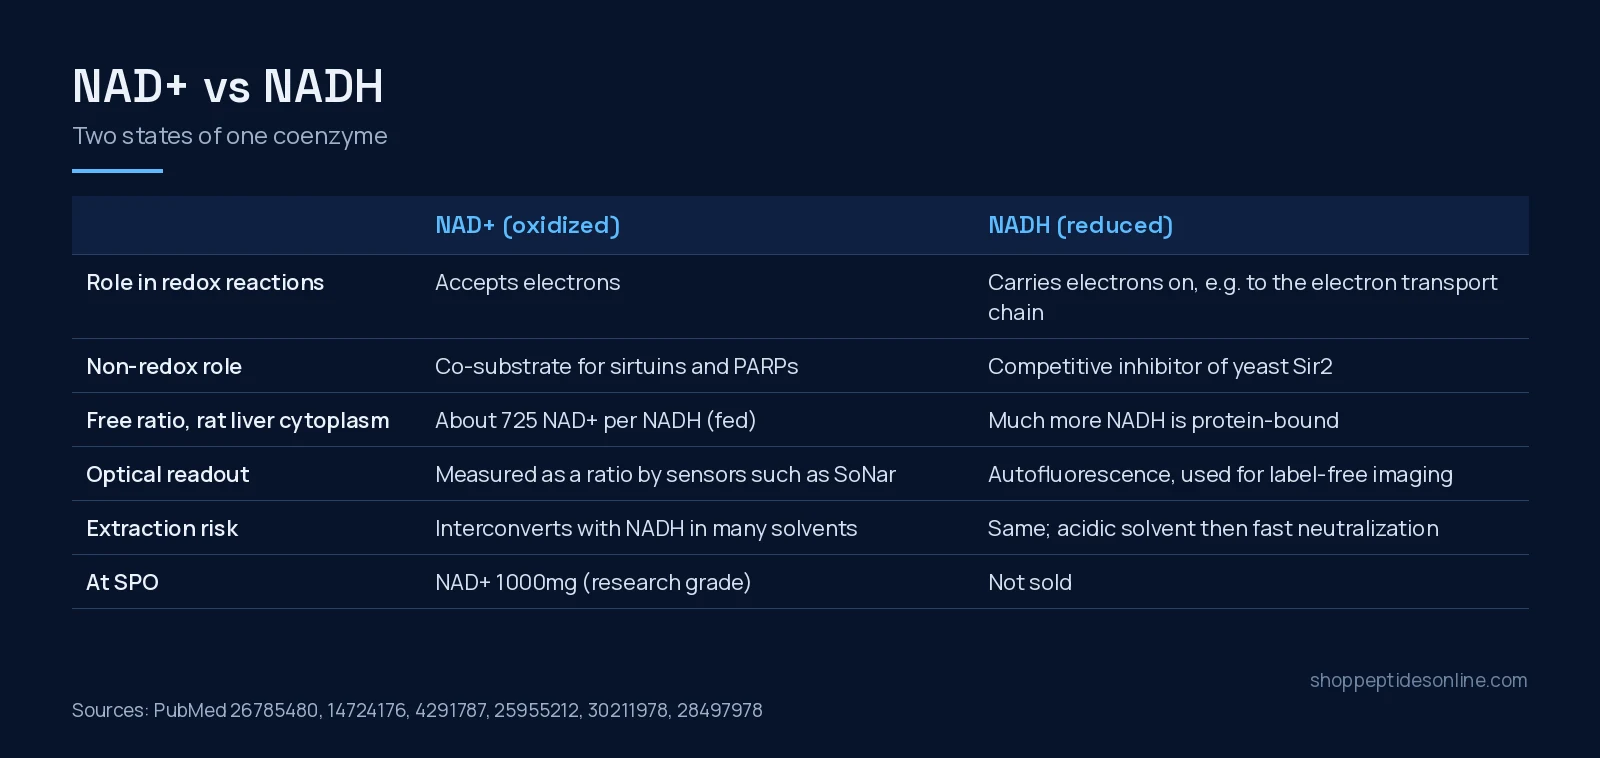
Short answer: NAD+ and NADH are not two different compounds in the way most “vs” pairs are. They are the oxidized and reduced states of one coenzyme, nicotinamide adenine dinucleotide, which carries electrons between redox reactions and also serves, as NAD+, as a co-substrate for sirtuins and PARPs[1]. What matters in the lab is usually the ratio between them, and that ratio differs about 90-fold between the cytoplasm and the mitochondria of rat liver[2]. The practical difference for a researcher is in what each form does to enzymes, how each is measured, and how easily one turns into the other during sample handling[3][5].
Side by side
| NAD+ | NADH | |
|---|---|---|
| Redox state | Oxidized; accepts electrons[1] | Reduced; carries electrons onward[1] |
| Non-redox enzyme role | Co-substrate for sirtuins and PARPs[1] | Competitive inhibitor of yeast Sir2[3] |
| Free ratio in rat liver cytoplasm (fed) | About 725 NAD+ per NADH; about 8 in mitochondria[2] | |
| Protein binding | Less bound | Much more protein-bound, so free and total ratios differ[2] |
| Common readouts | Ratio sensors such as SoNar; 31P MRS in brain[7][8] | Autofluorescence and lifetime imaging[6] |
| At SPO | NAD+ 1000mg (research grade) | Not sold |
The ratio is the real variable
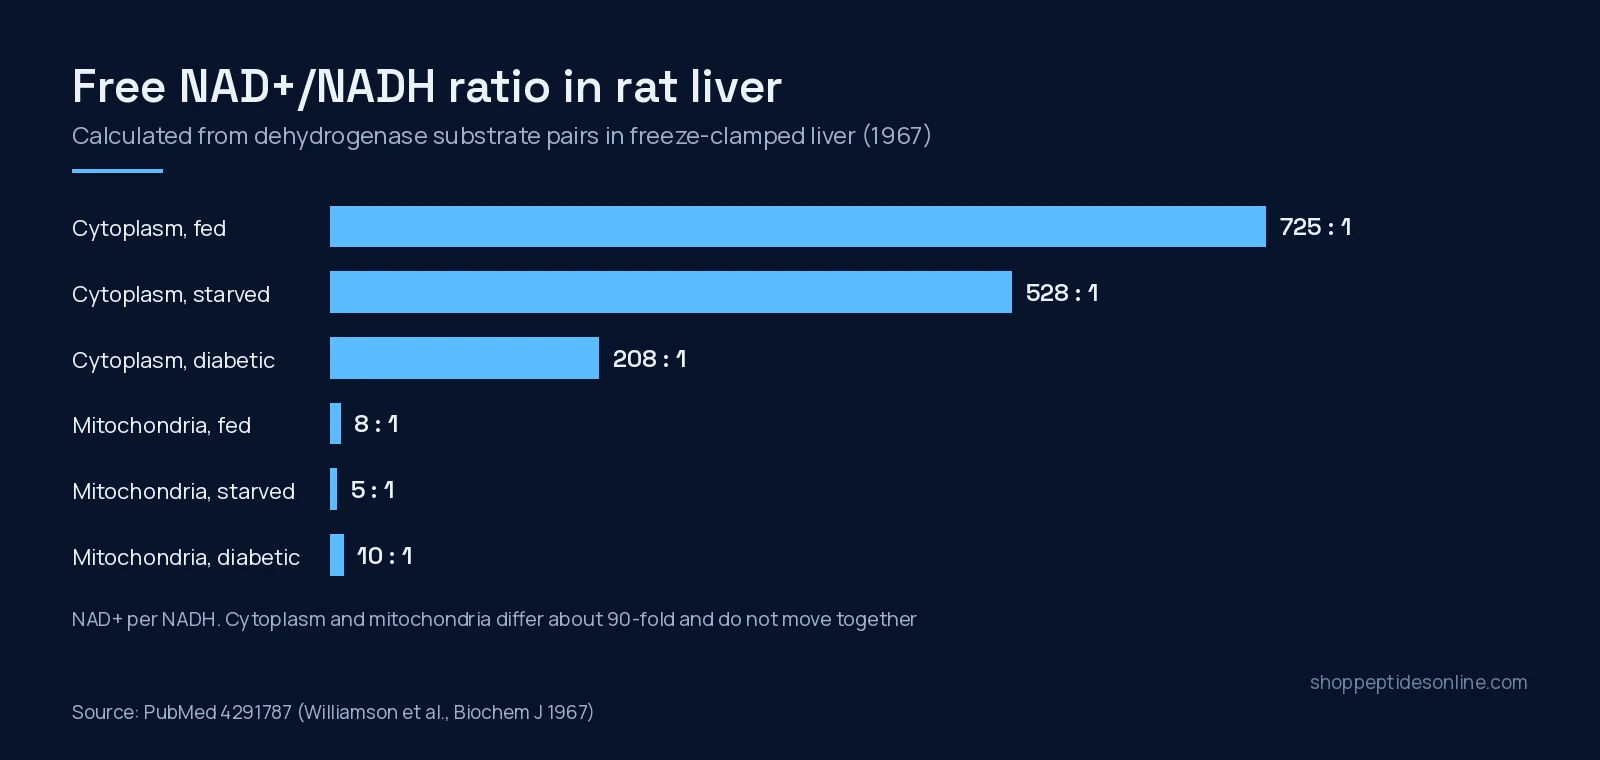
The classic measurement comes from 1967. Rat livers were freeze-clamped right after death, and the substrates of three dehydrogenases were measured: lactate dehydrogenase to report the cytoplasm, beta-hydroxybutyrate dehydrogenase for the mitochondrial cristae, and glutamate dehydrogenase for the matrix. From the equilibrium constants, the free NAD+/NADH ratio in the cytoplasm of well-fed rats was about 725, falling to 528 with starvation and 208 in alloxan-diabetic rats. In mitochondria it was about 8, about 5 in starvation and about 10 in diabetes[2].
Three points from that paper still shape experiments. The two compartments sit at very different redox states. They do not necessarily move in the same direction when metabolism changes. And because much more NADH than NAD+ is bound to protein, the free ratio is far from the total ratio a simple extraction reports[2].
Changing the ratio without changing the total
A 2016 study built a tool for exactly this. A water-forming NADH oxidase from Lactobacillus brevis (LbNOX), expressed in the cytosol or the mitochondria of human cells, raised the NAD+/NADH ratio in that compartment. With it, the authors showed that key metabolic fluxes, gluconeogenesis and signalling depend on the compartment-specific ratio, and that raising it eased the proliferative and metabolic defects caused by an impaired electron transport chain in cell culture[4]. Their framing was reductive stress: too much NADH relative to NAD+, not only too little ATP[4].
NADH can also act on enzymes directly. In yeast, calorie restriction lowered NADH levels, NADH competitively inhibited the NAD-dependent deacetylase Sir2, and a genetic change that lowered NADH alone extended replicative life span[3]. That is a yeast result, and it shows why NAD+ and NADH should not be treated as interchangeable additions to an assay.
Measuring each form
Sample preparation is the main trap. A comparison of seven quenching and extraction solvents found substantial interconversion between oxidized and reduced forms in most of them. Acidic 40:40:20 acetonitrile:methanol:water with 0.1 M formic acid gave the least interconversion and the best recoveries for LC-MS, samples needed neutralizing straight after extraction to avoid acid-catalysed degradation, and isotope labelling plus spiked standards let the authors track how much conversion still happened[5].
In living systems the two forms are read differently. NADH autofluorescence has been proposed as a marker of redox state for more than 60 years, and fluorescence lifetime imaging can separate different NADH pools within a cell, although technical limits remain[6]. The genetically encoded sensor SoNar reports the cytosolic NAD+/NADH redox state in living cells and in vivo, is pH-resistant, and was fast enough to support a screen of more than 5,500 compounds[7]. In the human brain, 31P magnetic resonance spectroscopy with 1H decoupling quantified NAD concentrations and the NAD+/NADH ratio at 4 tesla[8].
Which one fits which question?
- Sirtuin and PARP enzyme assays, NAD+ precursor work: NAD+[1].
- Redox state, reductive stress and electron transport: the NAD+/NADH ratio, by compartment[4][2].
- Label-free imaging of metabolism: NADH autofluorescence[6].
- Enzyme inhibition by the reduced form: NADH, as in the yeast Sir2 work[3].
For the precursors that feed the NAD+ pool, see NAD+ vs NMN vs NR, and our NAD+ research page covers the product. For the rest of the catalogue, see our guide to buy peptides online in Canada.
Frequently asked questions
What is the difference between NAD+ and NADH?
They are the oxidized (NAD+) and reduced (NADH) forms of the same coenzyme. NAD+ accepts electrons and is also a co-substrate for sirtuins and PARPs; NADH carries the electrons on.
What is the NAD+/NADH ratio in cells?
In rat liver, the free ratio was about 725 in the cytoplasm and about 8 in mitochondria of well-fed animals, and the two compartments did not change in parallel.
Can NADH inhibit sirtuins?
In yeast, NADH acted as a competitive inhibitor of the NAD-dependent deacetylase Sir2.
Why are NAD+ and NADH hard to measure?
The two forms interconvert during extraction in many solvents. An acidic acetonitrile, methanol and water mix with immediate neutralization reduced this for LC-MS.
Does Shop Peptides Online sell NADH?
No. SPO lists NAD+ for laboratory research only. NADH is not in the catalogue.
References
- Verdin E (2015). NAD⁺ in aging, metabolism, and neurodegeneration. Science. PMID: 26785480. doi: 10.1126/science.aac4854.
- Williamson DH, Lund P, Krebs HA (1967). The redox state of free nicotinamide-adenine dinucleotide in the cytoplasm and mitochondria of rat liver. Biochem J. PMID: 4291787. doi: 10.1042/bj1030514.
- Lin SJ, Ford E, Haigis M et al. (2004). Calorie restriction extends yeast life span by lowering the level of NADH. Genes Dev. PMID: 14724176. doi: 10.1101/gad.1164804.
- Titov DV, Cracan V, Goodman RP et al. (2016). Complementation of mitochondrial electron transport chain by manipulation of the NAD+/NADH ratio. Science. PMID: 27124460. doi: 10.1126/science.aad4017.
- Lu W, Wang L, Chen L et al. (2018). Extraction and Quantitation of Nicotinamide Adenine Dinucleotide Redox Cofactors. Antioxid Redox Signal. PMID: 28497978. doi: 10.1089/ars.2017.7014.
- Schaefer PM, Kalinina S, Rueck A et al. (2019). NADH Autofluorescence-A Marker on its Way to Boost Bioenergetic Research. Cytometry A. PMID: 30211978. doi: 10.1002/cyto.a.23597.
- Zhao Y, Hu Q, Cheng F et al. (2015). SoNar, a Highly Responsive NAD+/NADH Sensor, Allows High-Throughput Metabolic Screening of Anti-tumor Agents. Cell Metab. PMID: 25955212. doi: 10.1016/j.cmet.2015.04.009.
- Lu M, Zhu XH, Chen W (2016). In vivo (31) P MRS assessment of intracellular NAD metabolites and NAD(+) /NADH redox state in human brain at 4 T. NMR Biomed. PMID: 27257783. doi: 10.1002/nbm.3559.