For laboratory research only. Not for human or animal use. This article gives no dosing, administration or therapeutic advice.
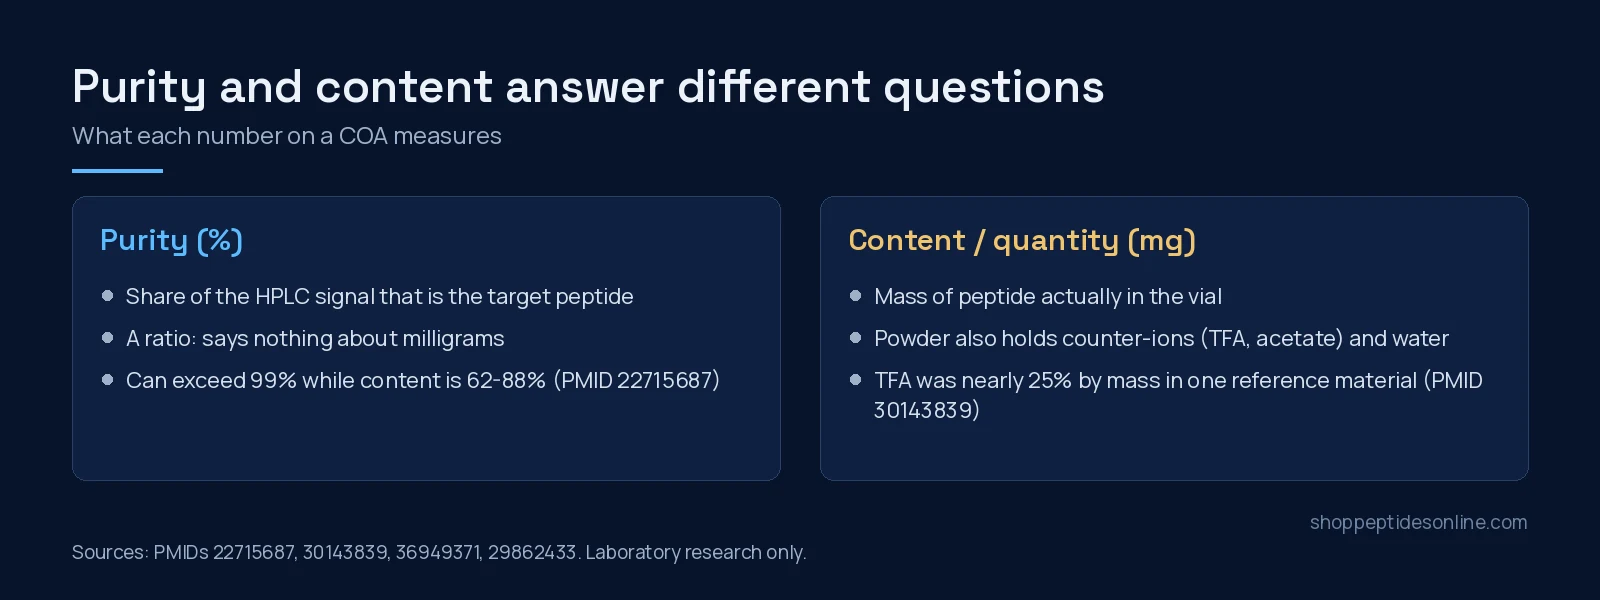
Short answer: a certificate of analysis usually reports two different numbers. Purity (a percentage) tells you how clean the peptide is. Quantity (milligrams) tells you how much peptide the lab measured in the vial. A vial can be 98% pure and still hold less peptide than the label says. The reason is that a lyophilized powder is never 100% peptide by weight[3][2].
Five SPO reports, as printed
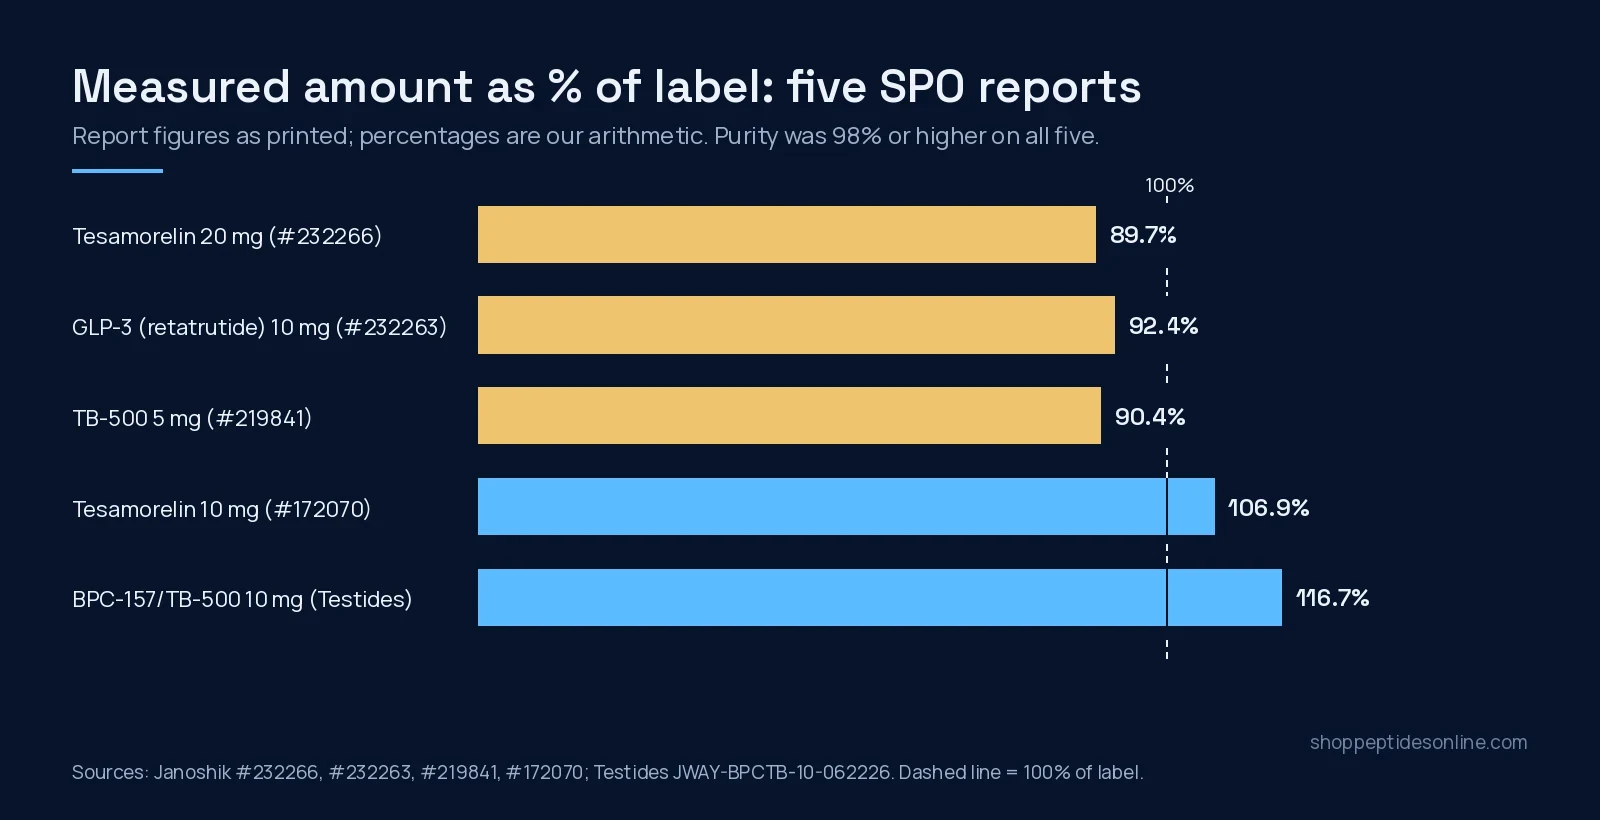
These figures come from reports filed in the SPO COA library. They are copied exactly as the reports state them, with no rounding and no correction. The “% of label” column is our arithmetic, not a figure on the reports.
| Product | Label | Measured (report) | % of label | Purity (report) | Report | Analysed |
|---|---|---|---|---|---|---|
| Tesamorelin | 20 mg | 17.94 mg | 89.7% | 98.010% | Janoshik #232266 | 21 Sep 2026 |
| GLP-3 (retatrutide) | 10 mg | 9.24 mg | 92.4% | 99.079% | Janoshik #232263 | 21 Sep 2026 |
| TB-500 | 5 mg | 4.52 mg | 90.4% | 99.371% | Janoshik #219841 | 20 Aug 2026 |
| Tesamorelin | 10 mg | 10.69 mg | 106.9% | 98.628% | Janoshik #172070 | 18 Jun 2026 |
| BPC-157/TB-500 blend | 10 mg | 11.67 mg | 116.7% | 98.75% | Testides JWAY-BPCTB-10-062226 | 14 Aug 2026 (reported) |
Three of the five reports come in below the label and two above. Every one shows purity at or above 98%. That spread is the point of this article. Purity and quantity are separate measurements, and a high number for one says nothing about the other.
Purity is a ratio, not an amount
HPLC purity compares the target peptide’s peak with the other peaks the detector sees under the same conditions, which are mostly structurally related peptide impurities[9]. That makes it a relative measure. Reference-standard work treats identity, purity and strength (content) as separate attributes, each with its own tests[1]. A related-impurity profile can be very detailed. One synthetic C-peptide study material had more than 65 structurally related impurities, totalling 83.3 mg/g[9]. None of that detail tells you the mass of peptide in a vial.
Where the rest of the mass goes
A peptide made by solid-phase synthesis is cleaved and purified with trifluoroacetic acid (TFA). So it usually leaves the process as a TFA salt[6]. Counter-ions, water and other non-peptide material all add weight without adding peptide. Studies that measured these directly give a sense of scale:
- Angiotensin II reference material. TFA counter-ion made up nearly 25% by mass. The final assigned purity (mass fraction) was 691 ± 9 mg/g, meaning about 69% of the powder was angiotensin II[2].
- Synthetic peptides quantified by amino acid analysis. Chromatographic purity was above 99% for all of them, yet peptide content ranged from 62.07% to 88.18%[3].
- Lecirelin batches. Counter-ion content ran from zero up to about 9% (trifluoromethanesulfonic acid), 3% (TFA) and 11% (acetic acid) by mass[4].
- Synthetic oxytocin. A mass-balance assignment had to measure water, non-volatile counter-ions, inorganic elements and residual solvents separately before arriving at 796.5 mg/g[7].
Acetate and TFA can both be measured directly, for example by capillary electrophoresis, 19F-NMR or HPLC with light-scattering detection[5][6]. Most research-market COAs do not report them.
How “milligrams” gets measured, and why methods disagree
There are several routes to a quantity: HPLC against an external standard, quantitative NMR, amino acid analysis after hydrolysis, and nitrogen determination[8][9]. They don’t carry the same uncertainty. In a multi-laboratory USP study on oxytocin, an HPLC assay against a common bulk standard had the lowest between-lab variability. qNMR was simpler and faster[8]. Every approach has to correct for structurally related impurities, or the result is biased[9]. Reference-standard producers combine results from several labs to assign a single value[1].
The Janoshik reports above list HPLC quantity and purity, with mass spectrometry for identity. For what each technique can and can’t show, see HPLC purity vs mass-spec identity.
Reading the Tesamorelin 20 mg result
The Tesamorelin pen page prints this report as is: 17.94 mg against a 20 mg label, 98.010% purity. That’s 89.7% of the label amount at high purity. The report records the result. It does not say why, and we won’t guess on its behalf. The literature above points to the candidates:
- normal fill variation between vials;
- non-peptide mass (counter-ions, water) if the fill was weighed as gross powder;
- method and calibration differences in the quantity measurement.
Only additional reports on the same lot, or a lab that reports net peptide content, could separate these. The GLP-3 (retatrutide) 10 mg report (9.24 mg) and the TB-500 5 mg report (4.52 mg) fall in a similar range. The Tesamorelin 10 mg report (10.69 mg) and the blend report (11.67 mg) sit above their labels.
A checklist for any COA
- Is there a quantity in mg, or only a purity percentage? Some reports carry no purity at all. SPO’s GLOW and KLOW blend reports list only component amounts.
- Does the report number, date and sample name match the product and strength you’re looking at?
- Is identity confirmed by mass, separately from HPLC purity?
- If your work needs molar accuracy, is net peptide content or counter-ion content reported? If not, that is a known unknown[2][3].
Where no report exists for a strength, SPO’s product pages say so rather than borrowing another strength’s figures. To order, see buy peptides online in Canada.
Frequently asked questions
Does 99% purity mean the vial holds 99% of its label?
No. Purity is the share of the chromatographic signal that belongs to the target peptide. It says nothing about how many milligrams are in the vial. In one peptide study, materials above 99% purity by HPLC had a peptide content of 62–88% by mass.
What is net peptide content?
It is the mass fraction of the powder that is actually the peptide. The rest can be counter-ions such as TFA or acetate, water, and other non-peptide material. Reference-standard laboratories measure each of these separately.
Why did the Tesamorelin 20 mg report show 17.94 mg?
The report states 17.94 mg measured against a 20 mg label, with 98.010% purity. A report records the result, not the cause. Fill variation, counter-ion and water content, and measurement method are possible contributors, and a single report can’t tell them apart.
Can a vial test above its label?
Yes. In the SPO reports listed here, the Tesamorelin 10 mg report shows 10.69 mg and the BPC-157/TB-500 blend report shows 11.67 mg against a 10 mg label.
Related reading: BPC-157 Canada: 5mg and 10mg research vials, batch COA and shipping across provinces.
References
- McCarthy D, Han Y, Carrick K et al. (2023). Reference Standards to Support Quality of Synthetic Peptide Therapeutics. Pharm Res. PMID: 36949371. doi: 10.1007/s11095-023-03493-1.
- Melanson JE, Thibeault MP, Stocks BB et al. (2018). Purity assignment for peptide certified reference materials by combining qNMR and LC-MS/MS amino acid analysis results: application to angiotensin II. Anal Bioanal Chem. PMID: 30143839. doi: 10.1007/s00216-018-1272-7.
- Wang X, Qin W, Qian X et al. (2012). [Accurate quantification of synthetic peptides by amino acid-stable isotope dilution mass spectrometry]. Se Pu. PMID: 22715687. doi: 10.3724/sp.j.1123.2012.01035.
- Sázelová P, Kasicka V, Solínová V et al. (2006). Determination of purity degree and counter-ion content in lecirelin by capillary zone electrophoresis and capillary isotachophoresis. J Chromatogr B Analyt Technol Biomed Life Sci. PMID: 16687256. doi: 10.1016/j.jchromb.2006.04.006.
- Hettiarachchi K, Ridge S (1998). Capillary electrophoretic determination of acetic acid and trifluoroacetic acid in synthetic peptide samples. J Chromatogr A. PMID: 9764489. doi: 10.1016/s0021-9673(98)00328-8.
- Erckes V, Streuli A, Chamera Rendueles L et al. (2025). Towards a Consensus for the Analysis and Exchange of TFA as a Counterion in Synthetic Peptides and Its Influence on Membrane Permeation. Pharmaceuticals (Basel). PMID: 40872554. doi: 10.3390/ph18081163.
- Wang S, Wu P, Li M et al. (2022). Mass balance method for SI-traceable purity assignment of synthetic oxytocin. J Pharm Biomed Anal. PMID: 34656934. doi: 10.1016/j.jpba.2021.114401.
- Li C, Bhavaraju S, Thibeault MP et al. (2019). Survey of peptide quantification methods and comparison of their reproducibility: A case study using oxytocin. J Pharm Biomed Anal. PMID: 30640042. doi: 10.1016/j.jpba.2018.12.028.
- Li M, Josephs RD, Daireaux A et al. (2018). Identification and accurate quantification of structurally related peptide impurities in synthetic human C-peptide by liquid chromatography-high resolution mass spectrometry. Anal Bioanal Chem. PMID: 29862433. doi: 10.1007/s00216-018-1155-y.